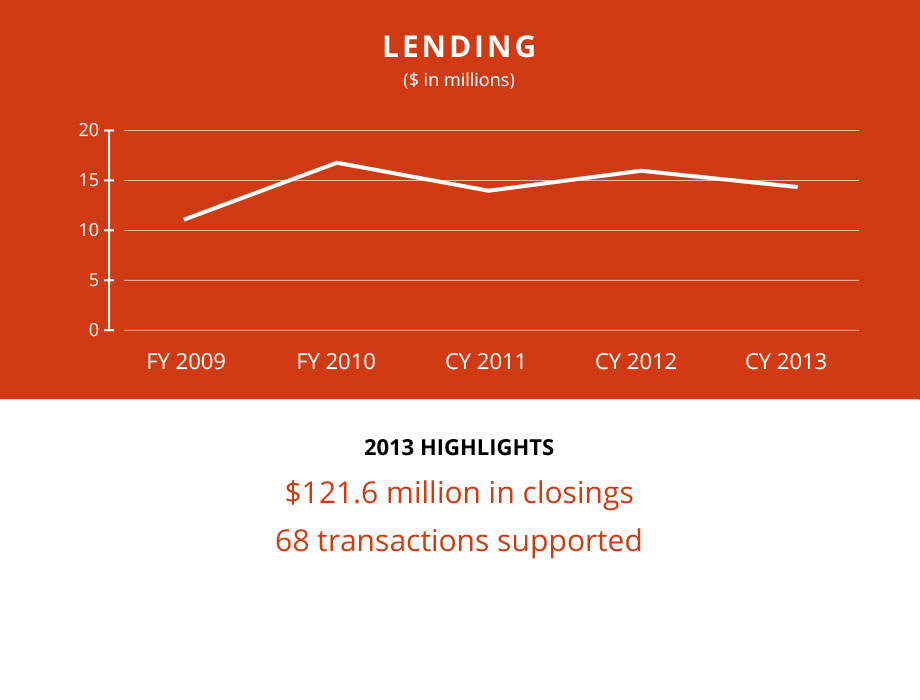
TRF Financing Transactions Closed in Calendar Year 2013:$121.6 Million in 68 Transactions
Total: 16 Transactions $18,159,726
Total: 15 Transactions $27,629,763
Total: 29 Transactions $70,868,254
Total: 8 Transactions $4,990,000
TRF closed 68 financing transactions totaling $121.6 million in 2013. The following are selected financial highlights from the year.
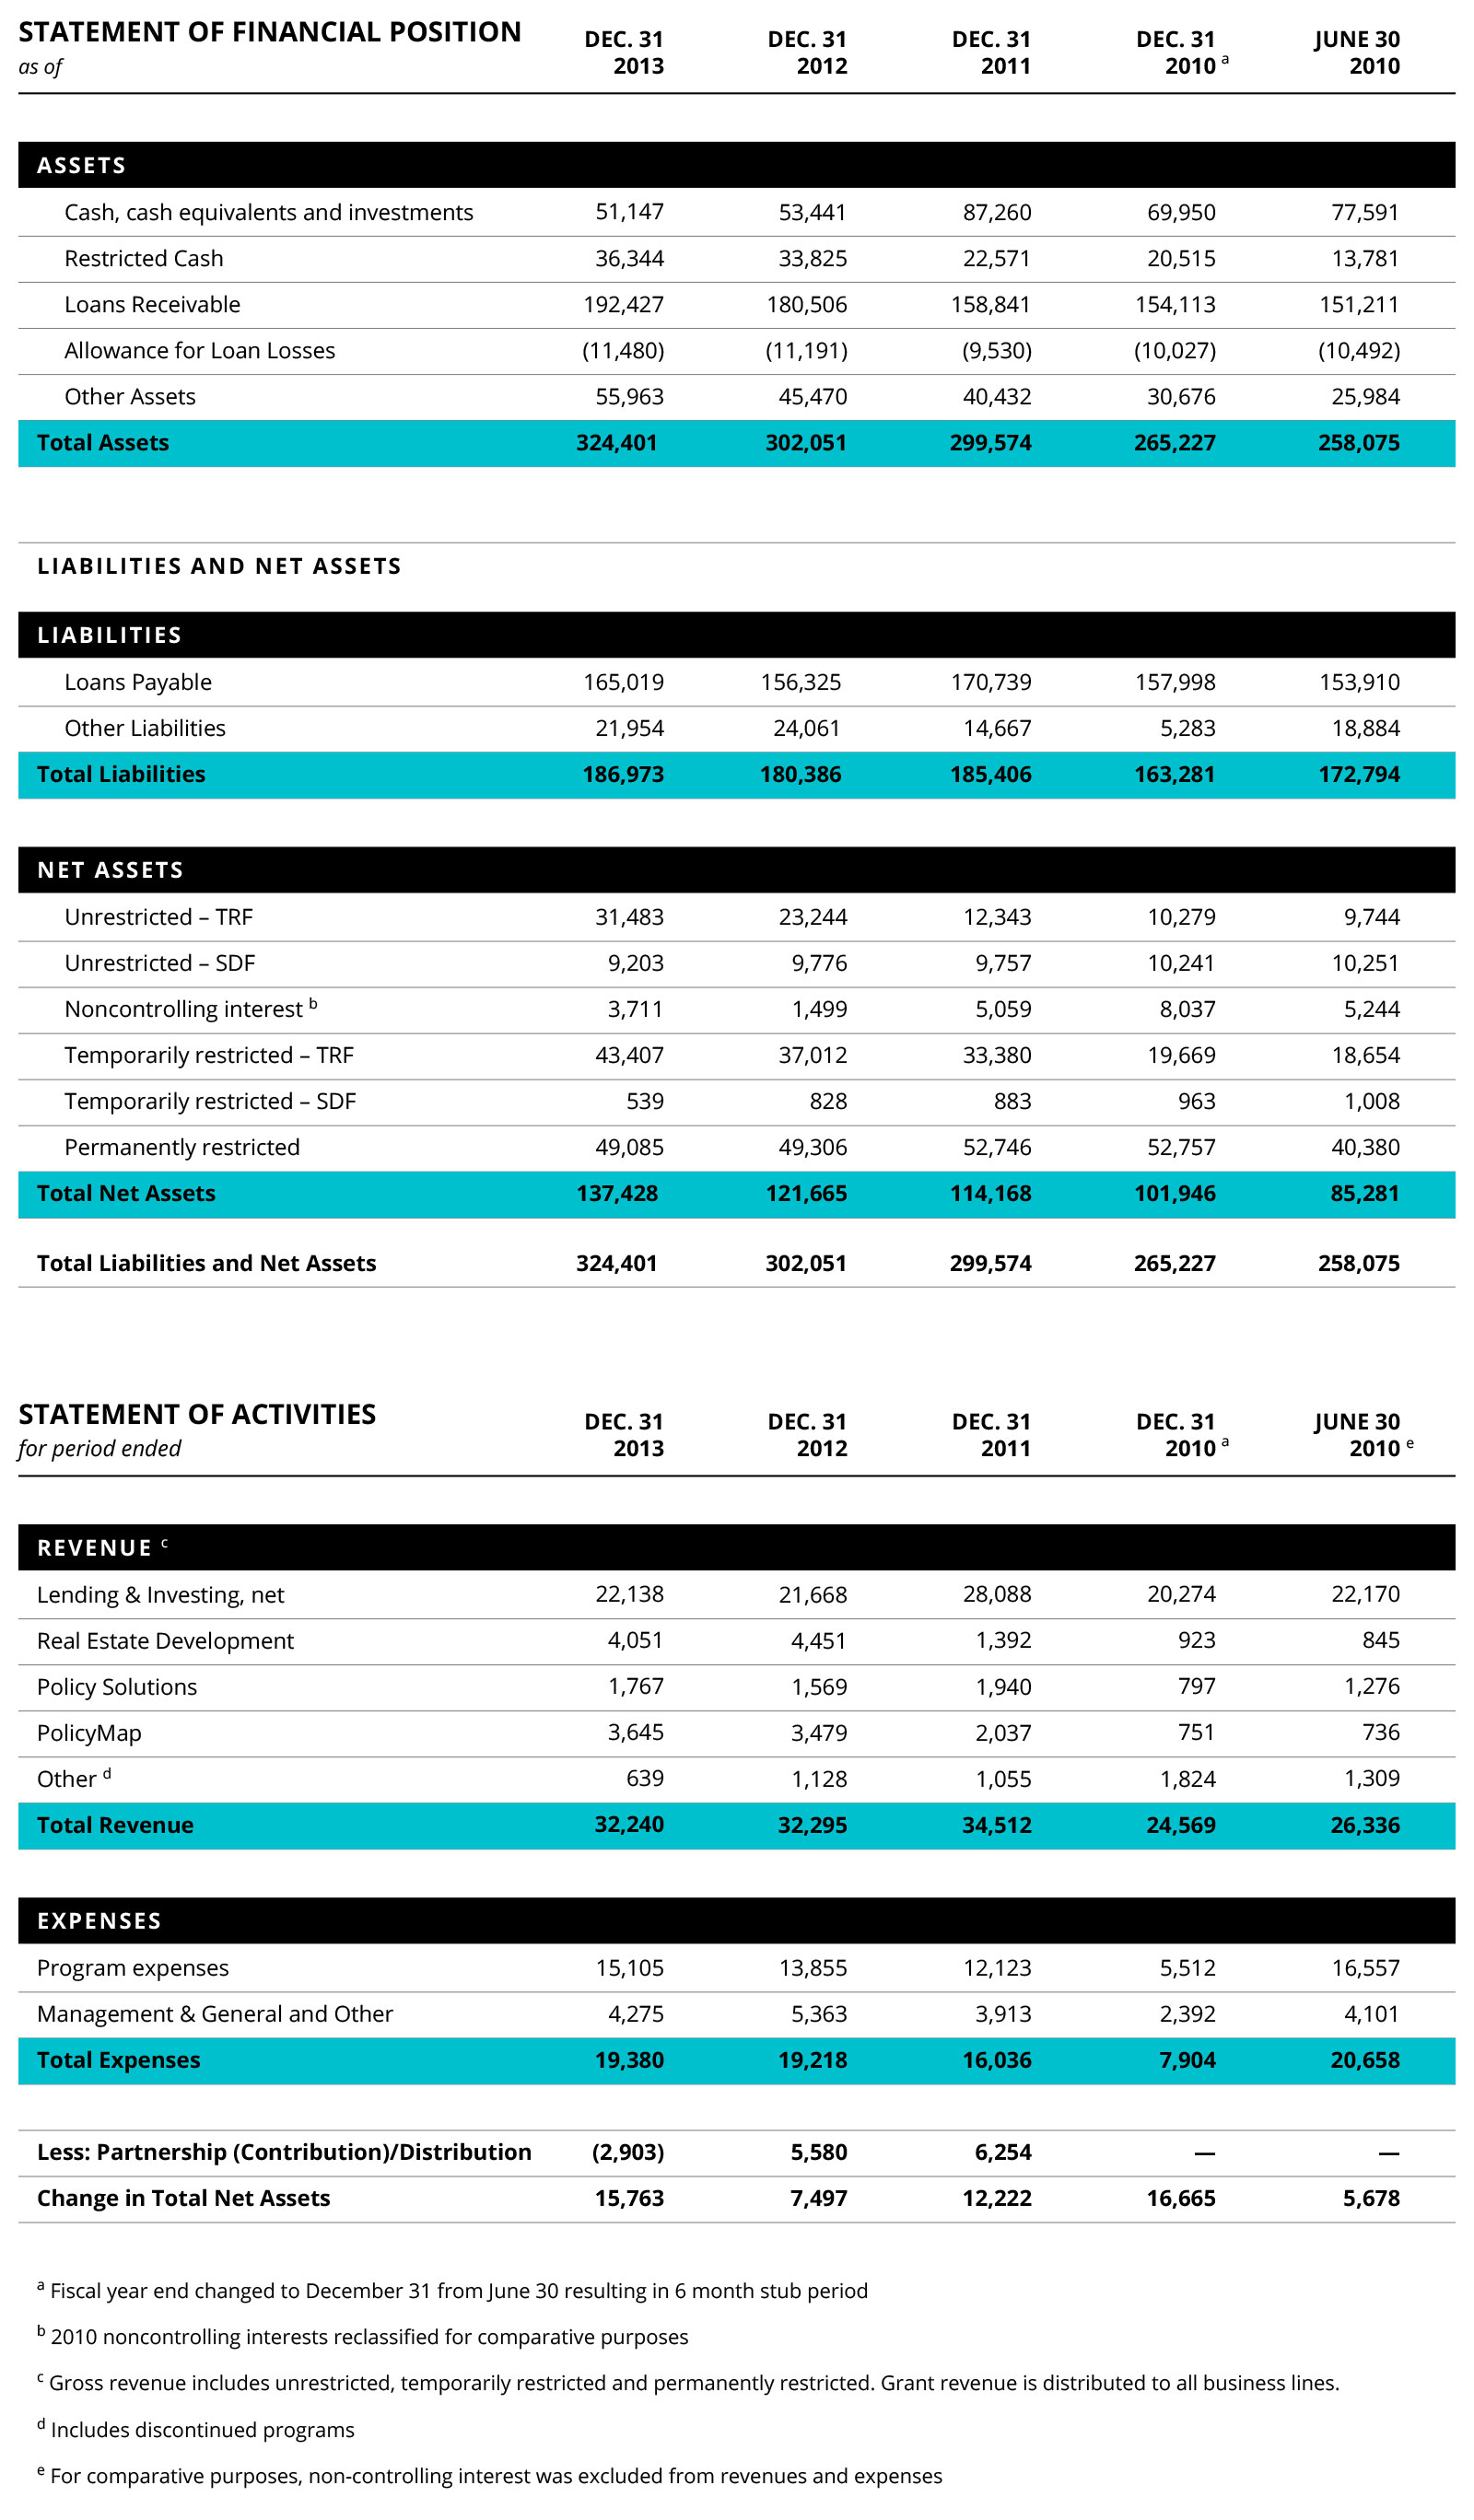
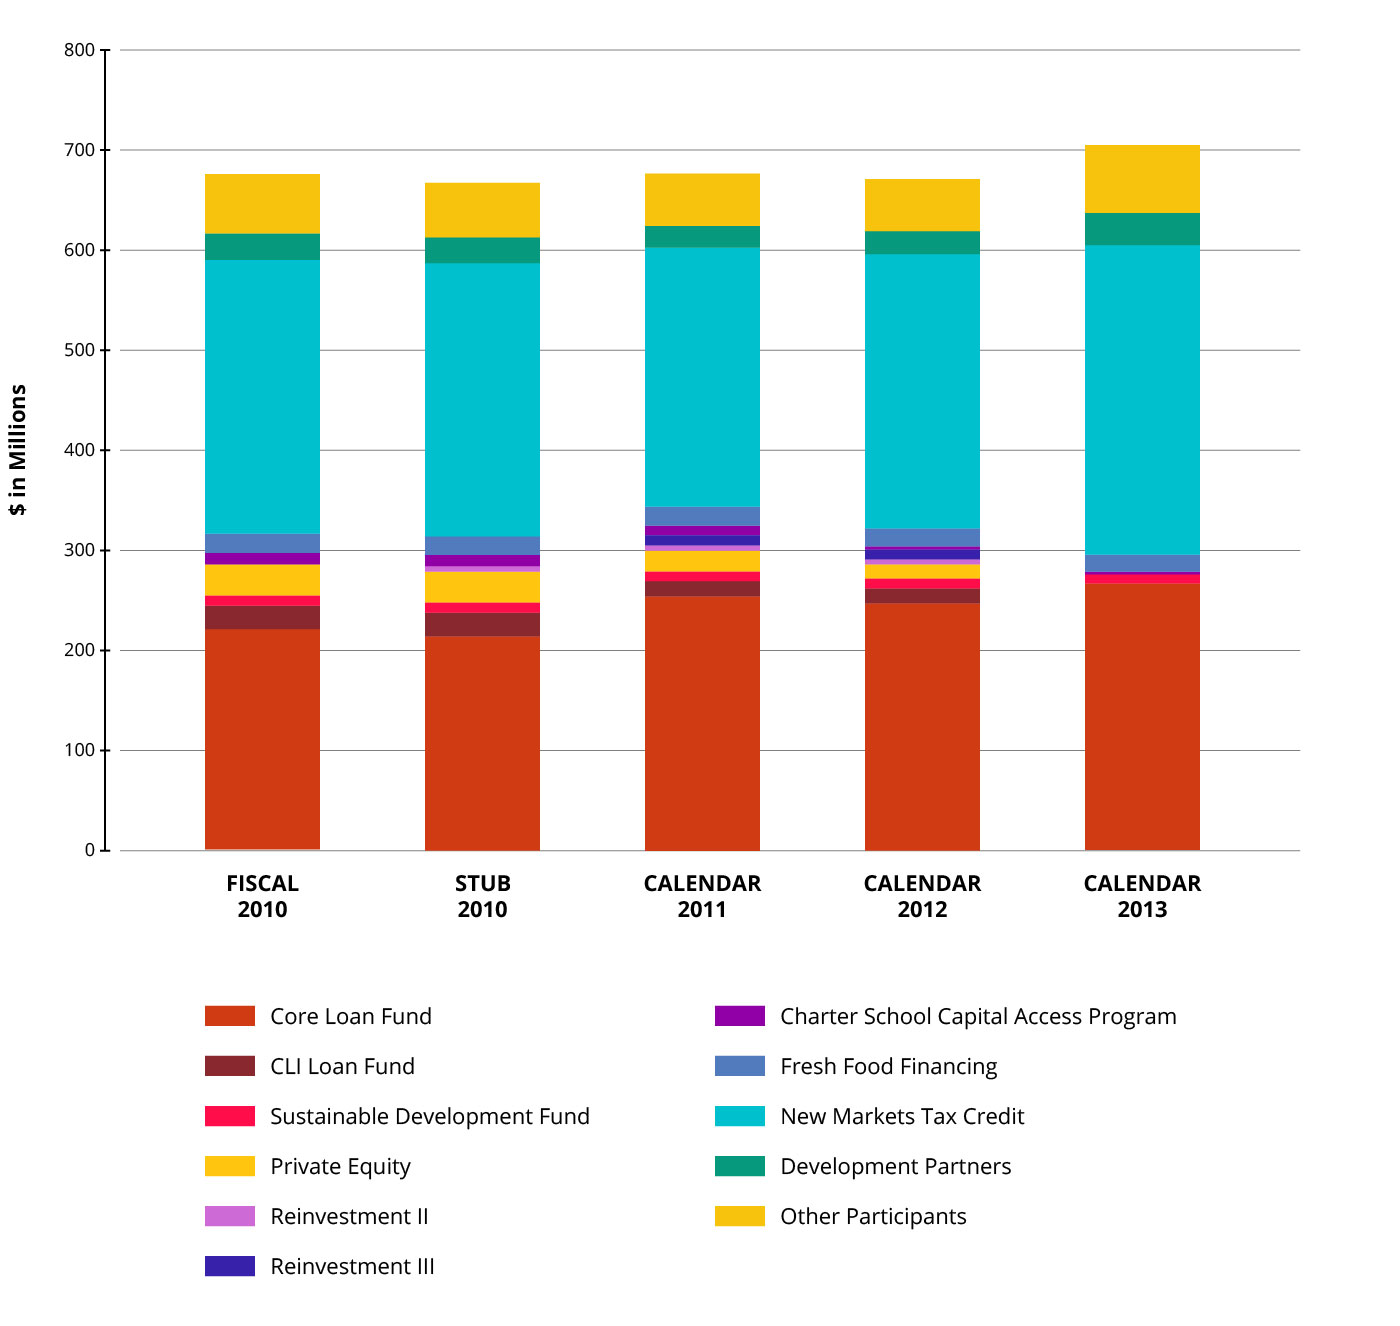
DOWNLOAD THE CY2013 AUDIT REPORTCapital under management totaled $705 million at December 31, 2013 as compared to $672 million at December 31, 2012, an increase of $33 million. This growth reflects significant capital support from many sources including a $45 million New Markets Tax Credits (NMTC) allocation, credit enhancement for Charter School financing from the U.S. Department of Education, increased support for our real estate development business, and increases in other credit facilities, partially offset by dissolution at maturity of our private equity partnerships and early round NMTC funds.
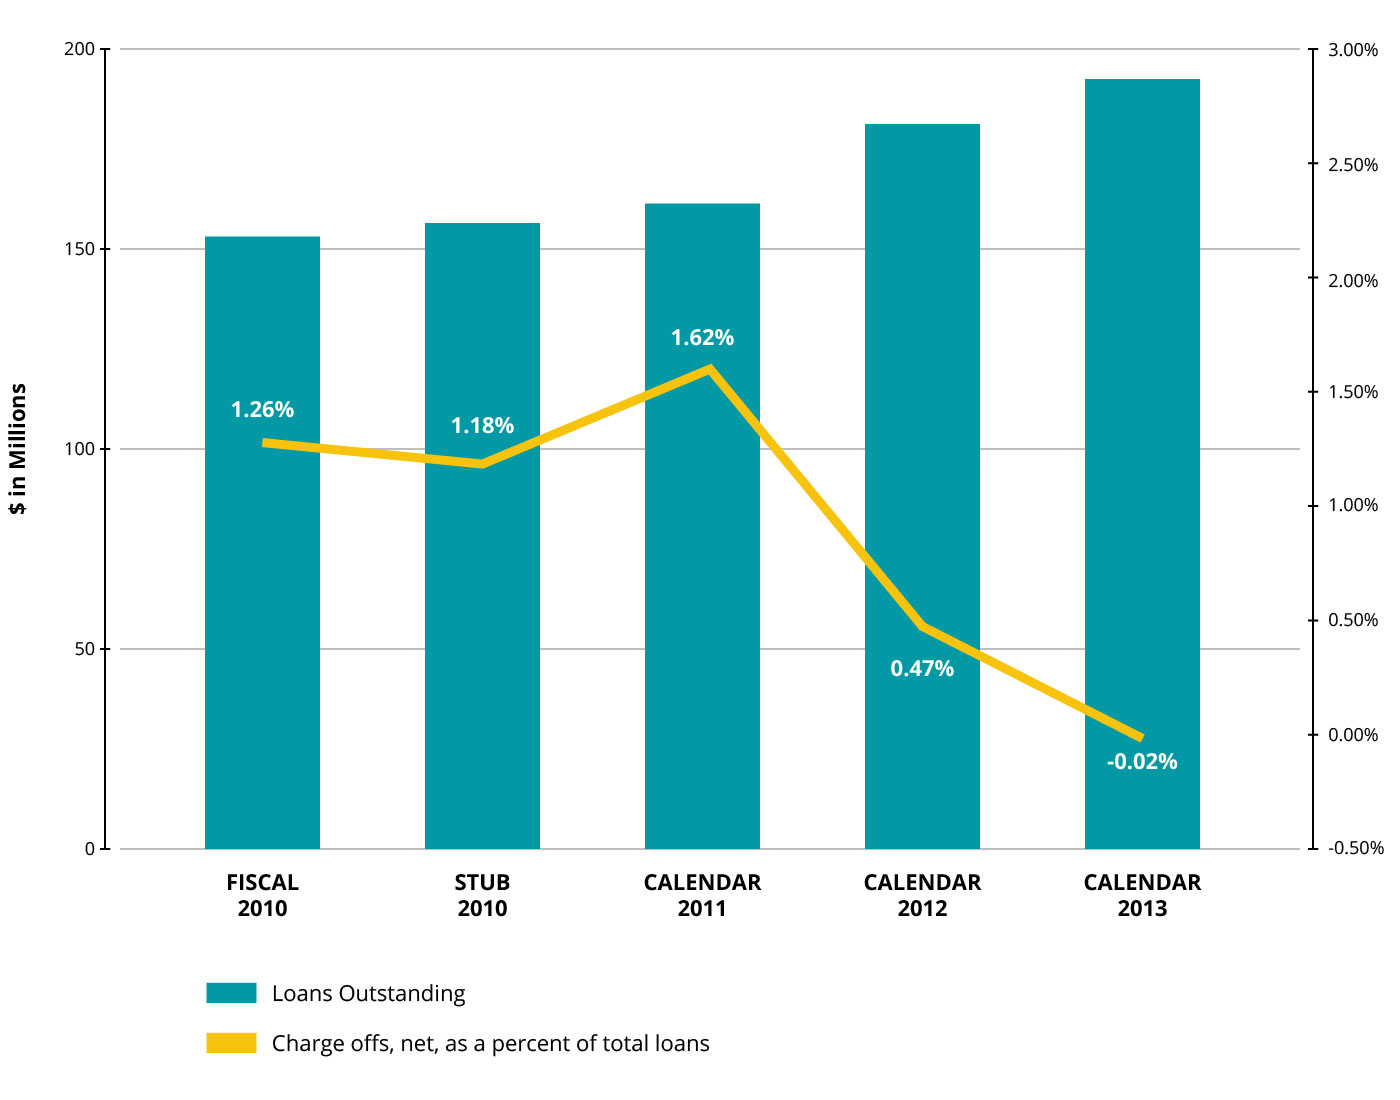
Loans and leases outstanding totaled $192.4 million at December 31, 2013, an increase of $11.9 million over prior year. Loan charge offs as a percentage of loans outstanding were elevated in 2010/2011 as a result of the Great Recession. Comparatively, 2012/2013 reflect a much lower level of charge offs as our loan portfolio recovered.
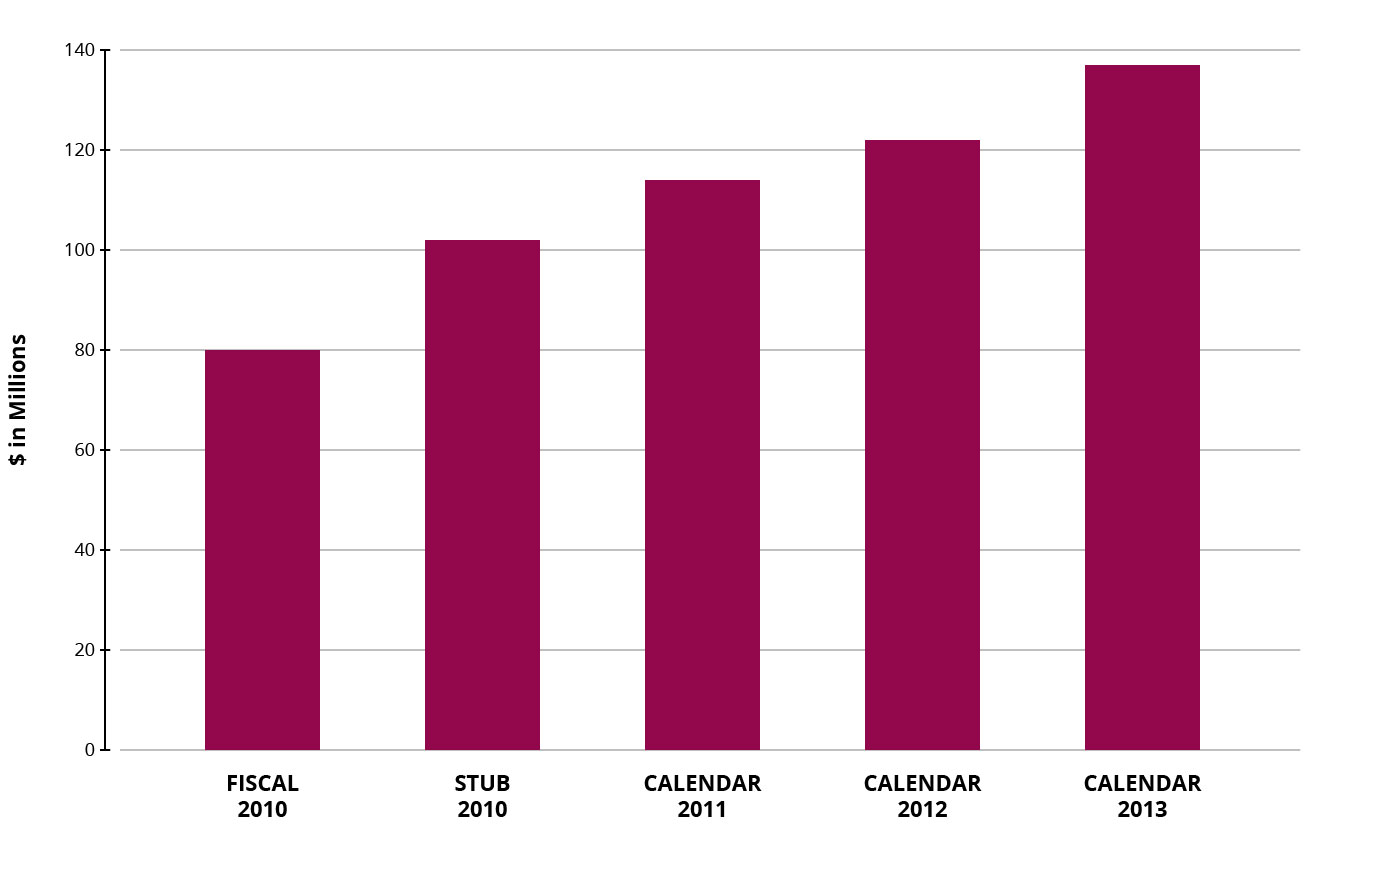
Total consolidated net assets increased $16 million to $137 million. Significant activity impacting net assets included a $3.5 million operating surplus (operating revenue less operating expense, excluding Sustainable Development Fund and non-controlling interest), grants in support of our Fresh Food Initiatives ($3 million CDFI grant and $2 million JPMorgan Chase), a $2.1 million grant from PIDC Energyworks in support of our energy efficiency program, a $6 million U.S. Department of Education Credit Enhancement for Charter School Facilities Program grant, operating support for our core programs ($500 thousand William Penn Foundation and $600 thousand Ford Foundation), and additional support for our real estate development business ($350 thousand Community Legacy and $300 thousand Open Society). In 2013, TRF also received $1.3 million from the CDFI Fund to support financing activities in Persistent Poverty Counties (counties where 20% or more of their population lives in poverty as measured by the U.S. Census Bureau).
Each of TRF’s four business lines provided positive operating contribution margins. The following are the revenue trends.