
Financial Summary CY2010
TRF closed 25 financing transactions totaling $47.8 million in calendar 2010 (7/1/2010 through 12/31/2010). The following are selected financial highlights from the past year. Click here for a CY2010 Audit Report or view a complete listing of TRF’s financing transactions for calendar 2010.
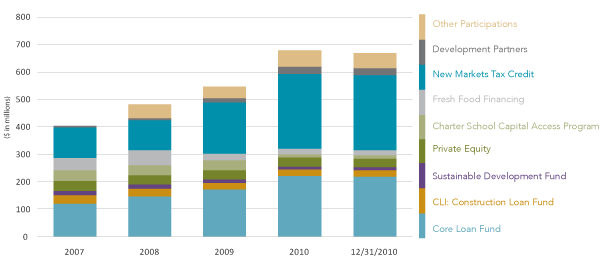
CAPITAL UNDER MANAGEMENT
LOANS AND LEASES OUTSTANDING

Loans and leases outstanding increased by $2.9 million in the six months ended December 31, 2010, with growth due to new loan closings partially offset by loan repayments and net charge offs. Net charge offs totaled $1.8 million, or 1.16% of total loans and leases outstanding, in line with the average for U.S. banks.
CONSOLIDATED NET ASSETS

Consolidated net assets increased by $21.9 million to $101.9 million. Significant activity impacting net assets included an operating surplus of $501 thousand, a large energy grant from the Pennsylvania Department of Environmental Protection in support of our energy program ($12 million) and a grant from the CDFI Fund ($750 thousand) in support of TRF's financing activities. New accounting disclosures requiring the inclusion of noncontrolling interests in consolidated subsidiaries as part of unrestricted net assets added $8 million.
FINANCIAL REVIEW HIGHLIGHTS
| Six months ended December 31 | As of June 30 | ||||
(dollars in thousands) |
2010 | 2010 | 2009 | 2008 | 2007 |
FINANCIAL POSITION DATA |
|||||
| Total assets | 265,228 | 258,075 | 234,177 | 194,358 | 179,886 |
| Loans and leases receivable | 154,113 | 151,211 | 143,334 | 113,829 | 91,646 |
| Allowance for loan and lease losses | 10,027 | 10,492 | 9,039 | 5,692 | 4,580 |
| Investments in marketable securities | 56,192 | 69,004 | 22,471 | 33,340 | 37,319 |
| Investments in limited partnerships & program investments | 1,592 | 1,810 | 2,132 | 2,437 | 3,516 |
| Private equity investments | 2,836 | 5,609 | 6,940 | 7,708 | 11,140 |
| Real estate held for development or sale | 19,659 | 19,659 | 5,546 | 6,779 | 1,557 |
| Loans payable | 157,998 | 153,911 | 149,711 | 107,363 | 95,520 |
Net assets (excluding SDF) |
|||||
| Unrestricted* | 18,316 | 9,744 | 8,289 | 11,649 | 9,943 |
| Temporarily restricted | 19,669 | 18,654 | 25,179 | 20,551 | 15,488 |
| Permanently restricted | 63,868 | 40,380 | 27,771 | 27,467 | 22,757 |
| 101,853 | 68,778 | 61,239 | 59,667 | 48,188 | |
Sustainable Development Fund (SDF) net assets |
|||||
| Unrestricted - contractually limited as to use | 10,241 | 10,251 | 10,179 | 10,108 | 10,777 |
| Temporarily restricted - contractually limited as to use | 963 | 1,008 | 1,130 | 1,727 | 4,685 |
| 11,204 | 11,259 | 11,309 | 11,835 | 15,462 | |
| Total consolidated net assets | 101,946 | 80,037 | 72,548 | 71,502 | 63,650 |
| Six months ended December 31 | Years ended June 30 | ||||
(dollars in thousands) |
2010 | 2010 | 2009 | 2008 | 2007 |
ACTIVITIES DATA |
|||||
| Net interest income (including loan and lease fees) | 2,431 | 5,304 | 5,957 | 6,704 | 6,407 |
| Provision for loan and lease losses | 830 | 2,083 | 3,888 | 1,217 | 1,521 |
| Asset management fees | 585 | 1,044 | 927 | 873 | 690 |
| Grants and contributions | 16,061 | 18,360 | 11,557 | 19,057 | 8,174 |
| Program services and fees and Other income | 3,458 | 5,106 | 2,479 | 2,077 | 2,764 |
| Change in net assets | |||||
| Total, excluding The Sustainable Development Fund | 16,720 | 7,539 | 1,572 | 11,479 | 3,575 |
| Sustainable Development Fund | (55) | (50) | (526) | (3,628) | (2,114) |
| Change in consolidated net assets | 16,665 | 7,490 | 1,046 | 7,851 | 1,461 |
OTHER DATA |
|||||
| Capital under management | 668,218 | 678,833 | 544,928 | 481,692 | 402,617 |
| Allowance for loan and lease losses as a % of total loans and leases |
6.51% | 6.90% | 6.30% | 5.00% | 5.00% |
| Net loan loss (recovery) ratio ** | 1.2% | 1.3% | 1.0% | 0.6% | 0.3% |
| Capital adequacy ratio, excluding SDF *** | 33% | 28% | 28% | 33% | 29% |
| Self sufficiency ratio - financing programs excluding SDF**** | 106% | 118% | 99% | 94% | 97% |
* Unrestricted net assets include non-controlling interest in consolidated subsidiaries effective December 31, 2010.
** Includes charge-offs supported by dedicated grant funds - FY10 $1,270k; FY2009 $930k; FY2008 $547k.
*** Capital adequacy ratio is calculated as net assets as a percentage of total assets.
**** Self sufficiency ratio is calculated as the sum of net interest income, loan fees, asset management fees, and grant revenue
designated for lending as a percentage of financing programs and related management and general expenses.